

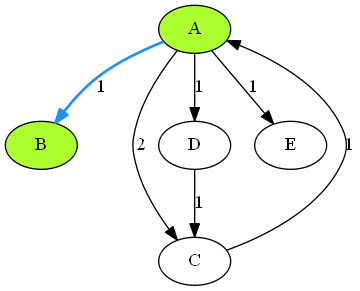
 上图是使用Graphviz画图的一个示例,它是由以下dot脚本生成的。
digraph G{
	A [style=filled, fillcolor=greenyellow];
	B [style=filled, fillcolor=greenyellow];
	C;
	D;
	E;

	A->B[label=1][style=bold, color=dodgerblue];
	A->C[label=2];
	A->D[label=1];
	A->E[label=1];
	C->A[label=1];
	D->C[label=1];
}
如果你没有graphviz请去http://www.graphviz.org/下载(windows在添加环境变量后要restart才能生效),或者到网页版体验一下。
编写你的脚本保存成文件,例如graph.gv。然后在当前路径下运行命令行,使用最基本的dot命令:dot 脚本路径 -格式 -o 生成图片路径
dot graph.gv -Tpng -o img.png
这样会生成一个img.png图片像上图一样,graphviz还有很多其他布局可以自己尝试。
dot语言
dot是一种很方便的描述语言,上面表示一个有向图的dot脚本简单分成3大部分:
①框框,表示构造一个有向图。
digraph G{

}
②顶点,(其实不写顶点A,B直接加边A->B会默认自动生成A,B顶点)。
一般格式是:顶点名称 [属性=值, 属性=值, ……] [属性=值, ……]
一个顶点后面的属性都默认描述这个顶点,边同理,顶点名称会默认作为显示的标签,如果加了label=… 则显示时会显示label。
后面属性说明会覆盖全局的属性说明。
A [style=filled, fillcolor=greenyellow];
B [style=filled, fillcolor=greenyellow];
C;
D;
E;
③边,边的一般格式是:起点->终点 [属性=值, ……] []
属性格式基本和顶点一样,可以重边,自环。
上图的脚本中只展示了样式,填充颜色,线条加粗几个属性,还有很多属性例如修改形状,对齐方案等等可以去看官方文档。
A->B[label=1][style=bold, color=dodgerblue];
A->C[label=2];
A->D[label=1];
A->E[label=1];
C->A[label=1];
D->C[label=1];
java中调用graphviz
下面讲怎么用java简单地调用graphviz画图。(当然也可以去找别人写好的工具,例如graphviz-java)
第一步我们要生成一个dot脚本
准备好图后我们要按顺序把图的信息写到字符串里再写到文件里。
StringBuilder dotText=new StringBuilder();	//StringBuilder在这里效率要高于用String加加加
dotText.append(String.format("digraph G{"+newLine));	//写入开头
for(Node node:G.getNodeList()) {	//遍历顶点写入顶点属性
	dotText.append(node.name);
	if(!node.color.equals("black"))dotText.append(String.format(" [style=filled, fillcolor=%s]",node.color));
	dotText.append(";"+newLine);
}
dotText.append(newLine);
for(Node node:G.getNodeList()) {	//遍历边写入边属性
	for(Edge edge:node.edges) {
		dotText.append(String.format("%s->%s[label=%d]", edge.from,edge.to,edge.weight));
		if(!edge.color.equals("black"))dotText.append(String.format("[style=bold, color=%s]",edge.color));
		dotText.append(";"+newLine);
	}
}
dotText.append("}"+newLine);	//写入结束
//把生成好的脚本写到指定的缓存路径下
String graphFilePath=Config.tmpPath+"graph.gv";
try {
	File tmpf=new File(Config.tmpPath);
	if(!tmpf.exists()) {
		tmpf.mkdirs();
	}
	FileWriter fw=new FileWriter(graphFilePath);
	BufferedWriter bufw = new BufferedWriter(fw);
	bufw.write(dotText.toString());
	bufw.close();
}catch (Exception e) {
	throw new RuntimeException("Failed to open file");
}
第二步调用graphviz生成图片
用java调用命令行的方式来执行dot命令。(在linux里是调用bash)。
java中可以用Runtime来执行命令,一般用法:
Runtime rt=Runtime.getRuntime();	//使用Runtime执行cmd命令
try {
	String[] args= {Config.dotForWindows,filename,"-Tpng","-o",Config.tmpPath+"img.png"};
	Process process = rt.exec(args);
	process.waitFor();

}catch (Exception e) {
	throw new RuntimeException("Failed to generate image.");
}
也可以写一行:
Runtime.getRuntime().exec(Config.dotForWindows+" "+filename+" -Tpng"+" -o"+" "+Config.tmpPath+"img.png").waitFor();
然后就可以去指定位置收集生成的图片了,也可以顺便用命令行执行mspaint img.png 展示出来。
上面的完整代码可见软工实验一 WordGraph/ShowGraph.java