

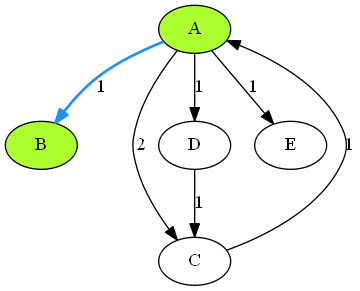
 上图是使用Graphviz画图的一个示例,它是由以下dot脚本生成的。
digraph G{
	A [style=filled, fillcolor=greenyellow];
	B [style=filled, fillcolor=greenyellow];
	C;
	D;
	E;

	A->B[label=1][style=bold, color=dodgerblue];
	A->C[label=2];
	A->D[label=1];
	A->E[label=1];
	C->A[label=1];
	D->C[label=1];
}